
Coming Soon 1Q 2027
semaiGEO
Satellite Data to Decision Services
Free satellite data, processed stage by stage into answers a client can act on: how fast the ground under an asset moves, how often a site flooded, which sites to send engineers to, and how much biomass lies within reach.
For the complete view, open this on a laptop, PC or tablet.
What semaiGEO Does
Optical scenes back to 1972, radar that sees through cloud, published radar interferograms, and other people's finished maps, taken through one pipeline into answers a client can act on.
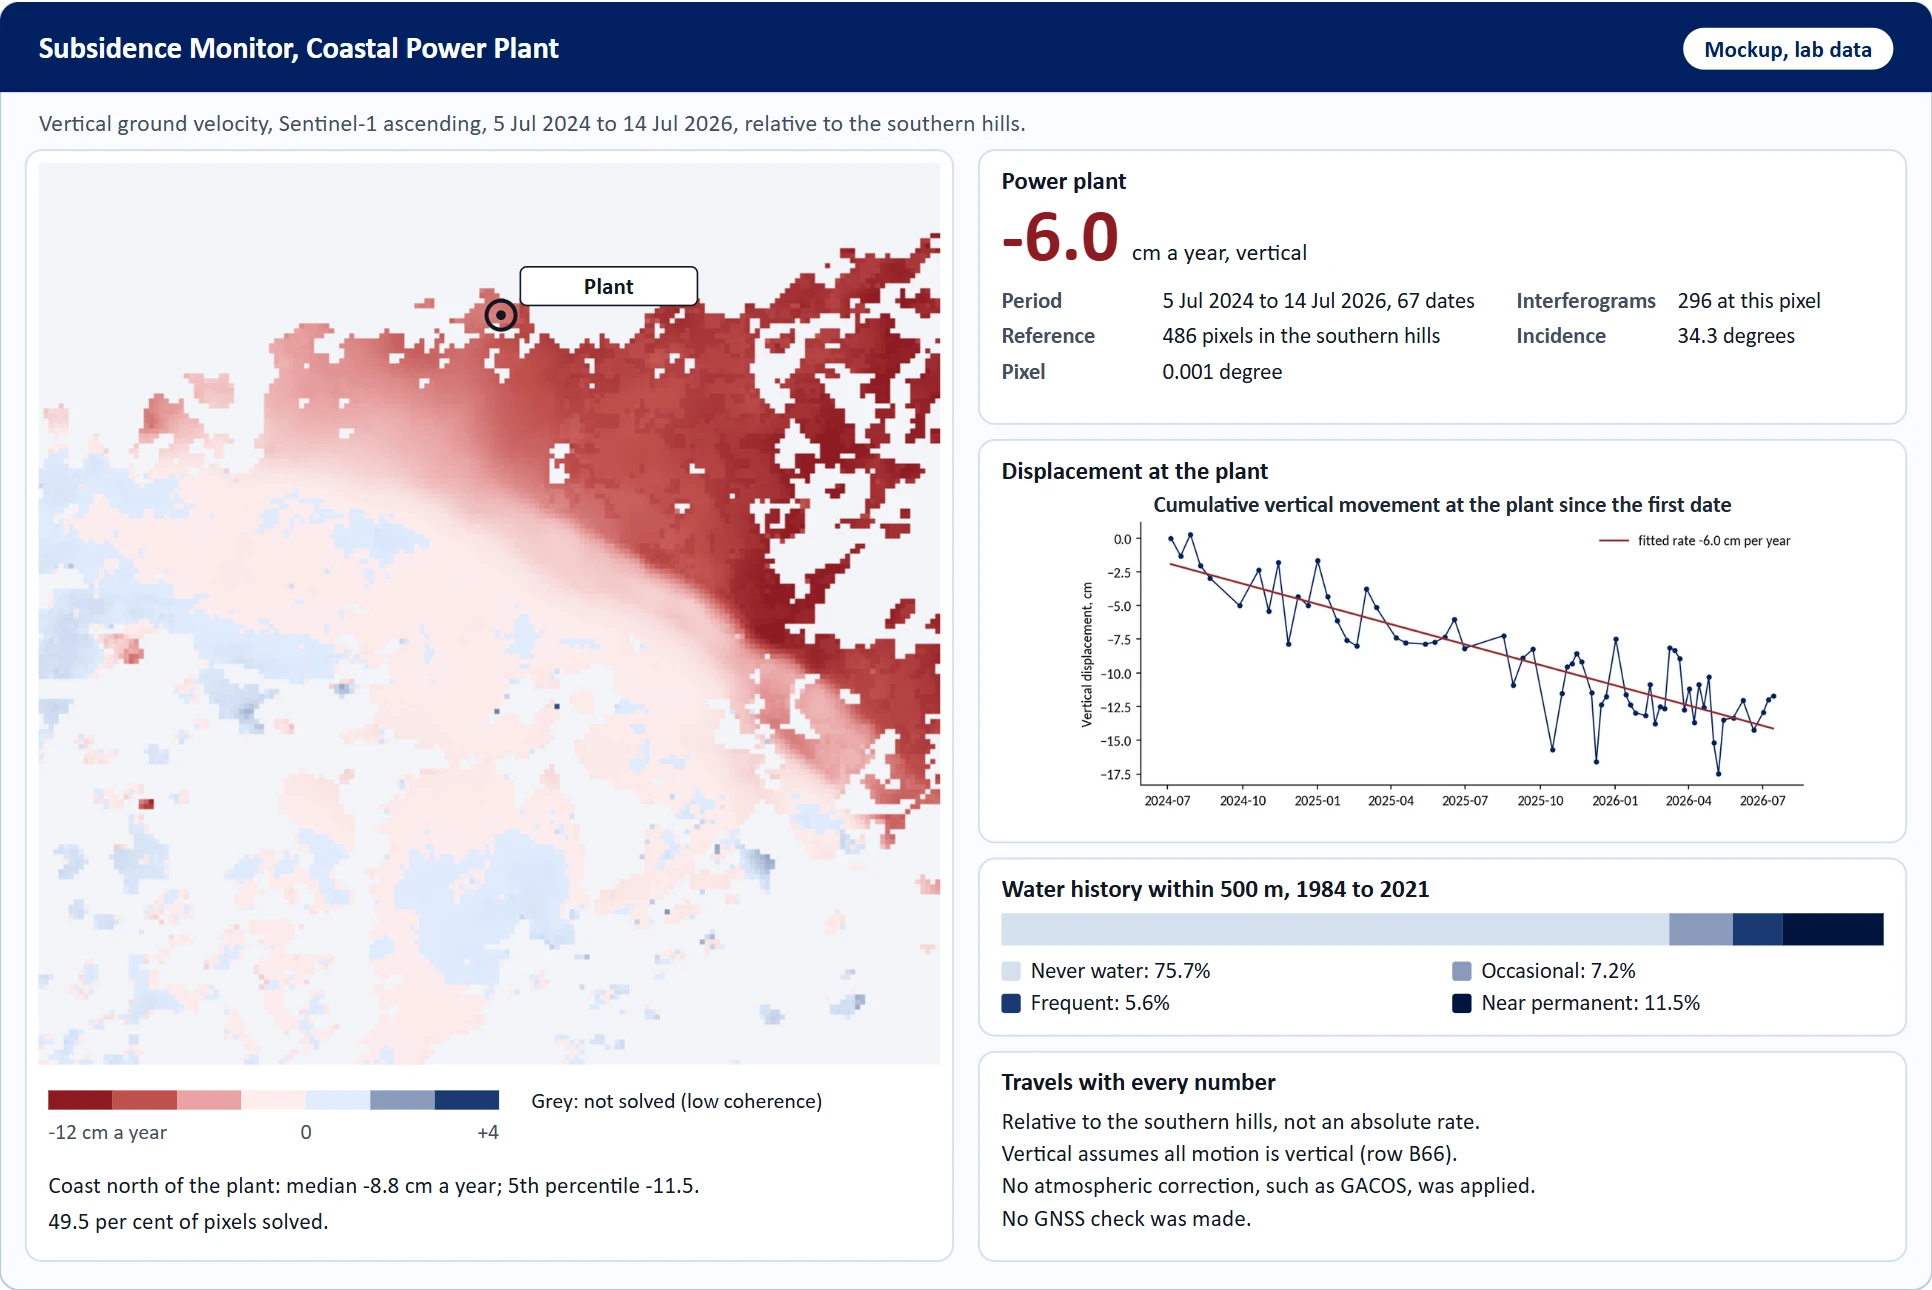
Ground Motion at Assets
Millimetres of movement a year at each asset, from radar phase differences between dates.
Water History
How often each 30 m pixel was water from 1984 to 2021, around a plant or a site.
Forest Change
The year each 30 m pixel lost its tree cover, inside any circle the client draws.
Palm Age and Biomass Supply
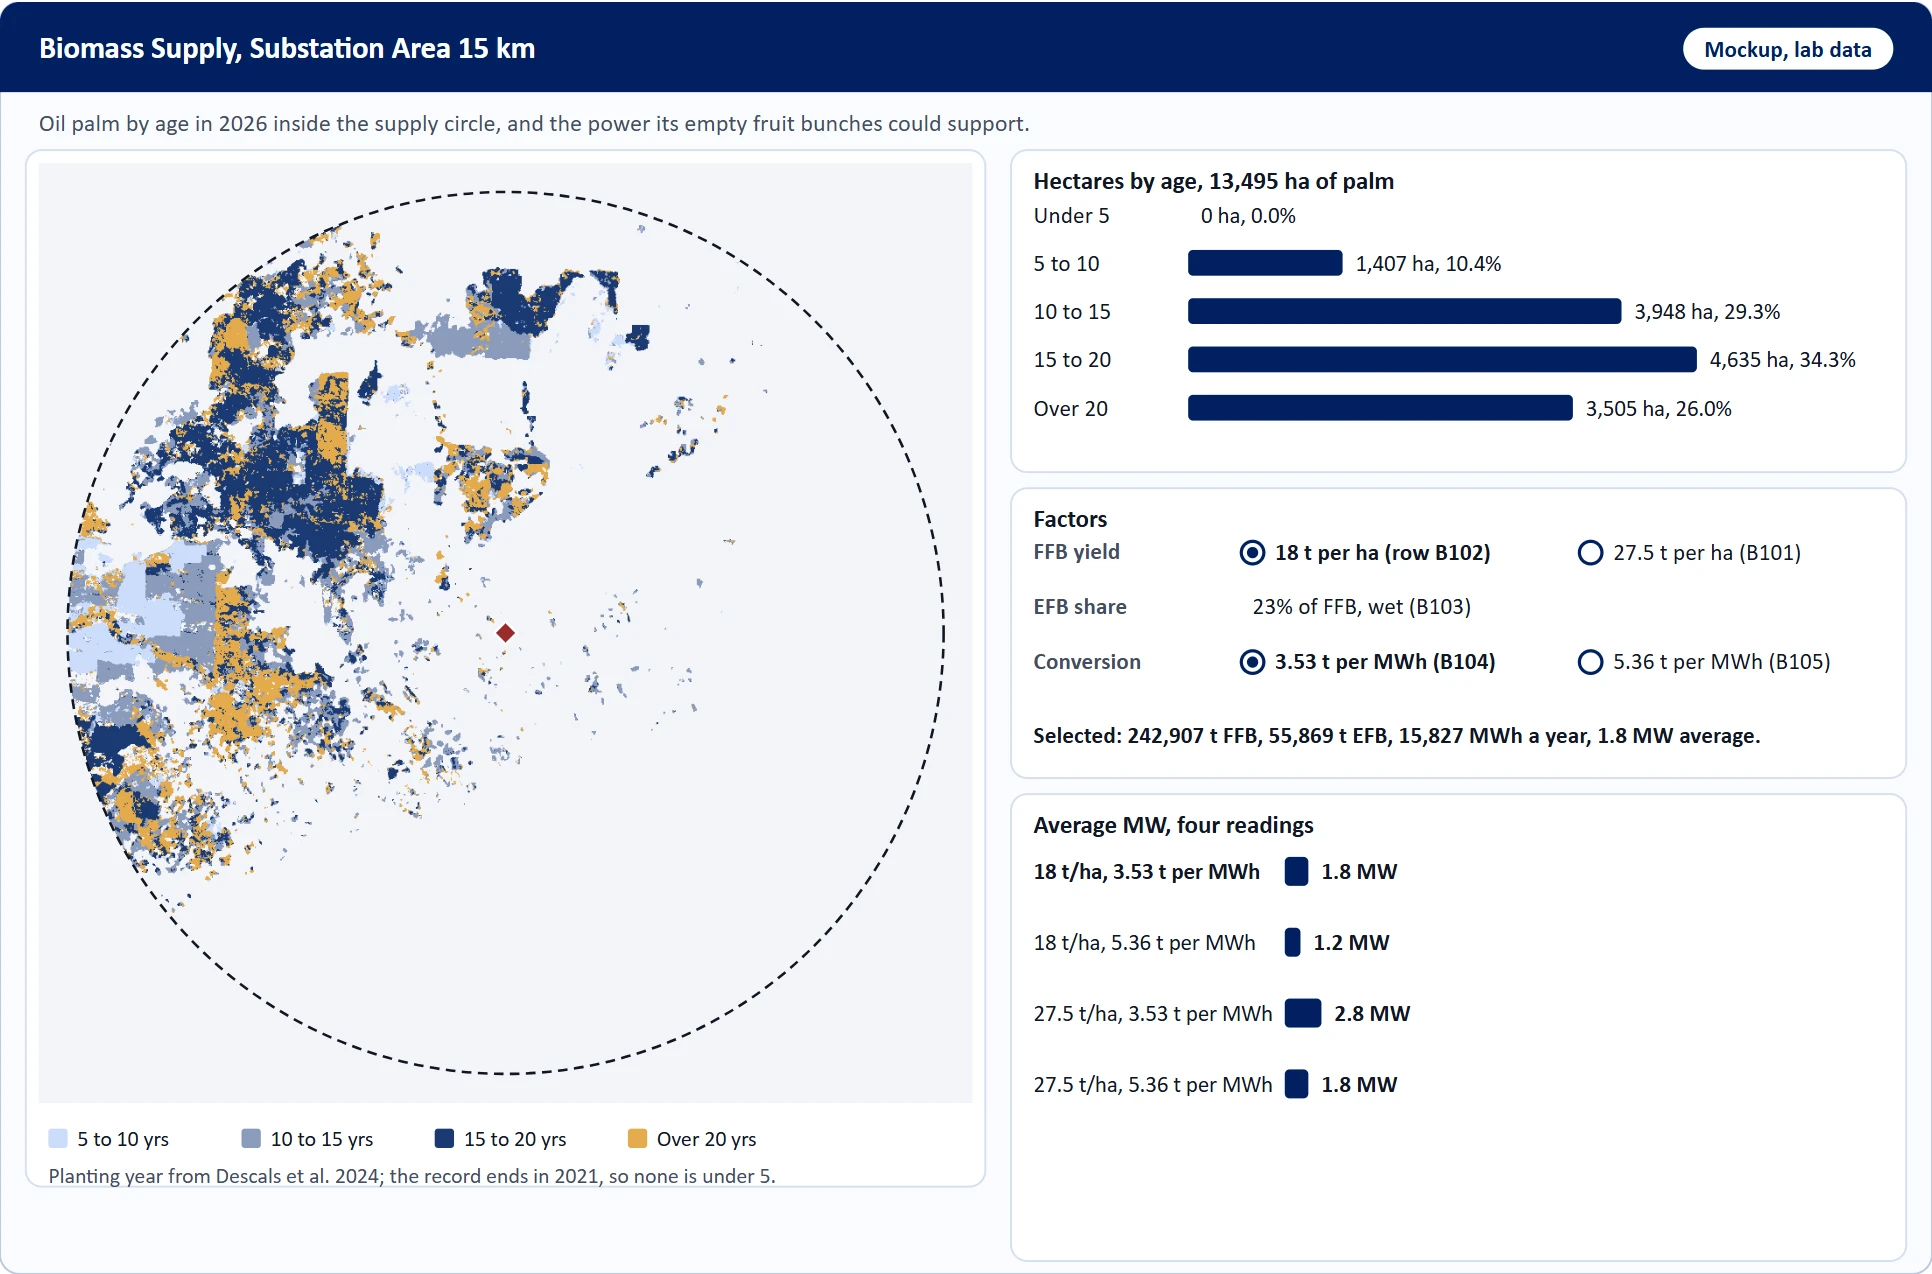
Palm by planting year, and the power its empty fruit bunches could support, with every factor shown.
Site Ranking
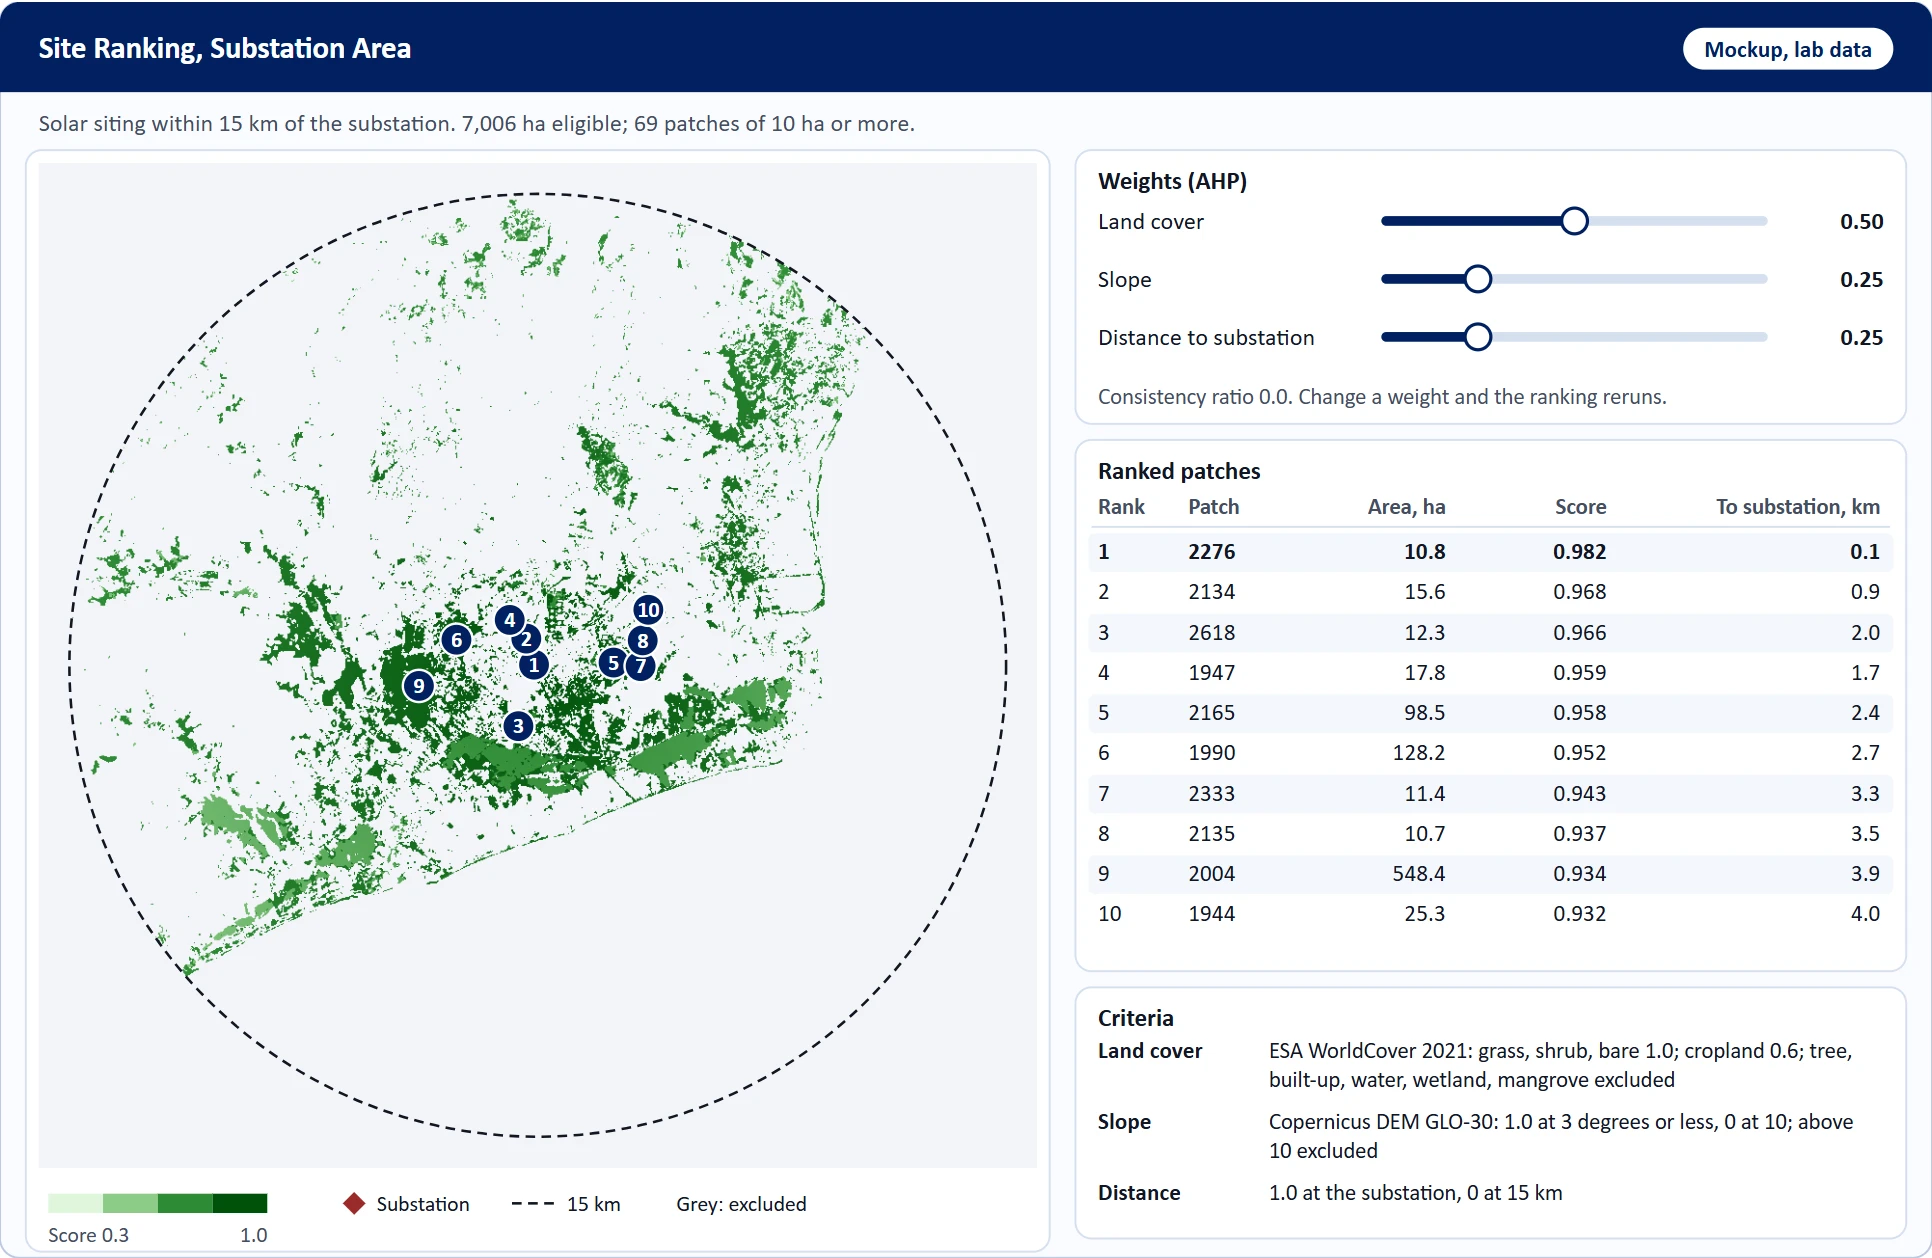
Land cover, slope and distance scored, weighted by pairwise judgement, grouped into sites and ranked.
Validated, Delivered Files
Each map checked against a sample with intervals, then written as files a client system can read.
Why semaiGEO
A client does not pay for the data; most of it is free. It pays for a team that reads only the pixels needed, processes them correctly, and says what each number means.
Radar Where Optical Stops
Over one area in East Kalimantan, none of the 84 optical scenes of 2025 was under 20% cloud; radar still gave 25 dates.
Free, Open Inputs
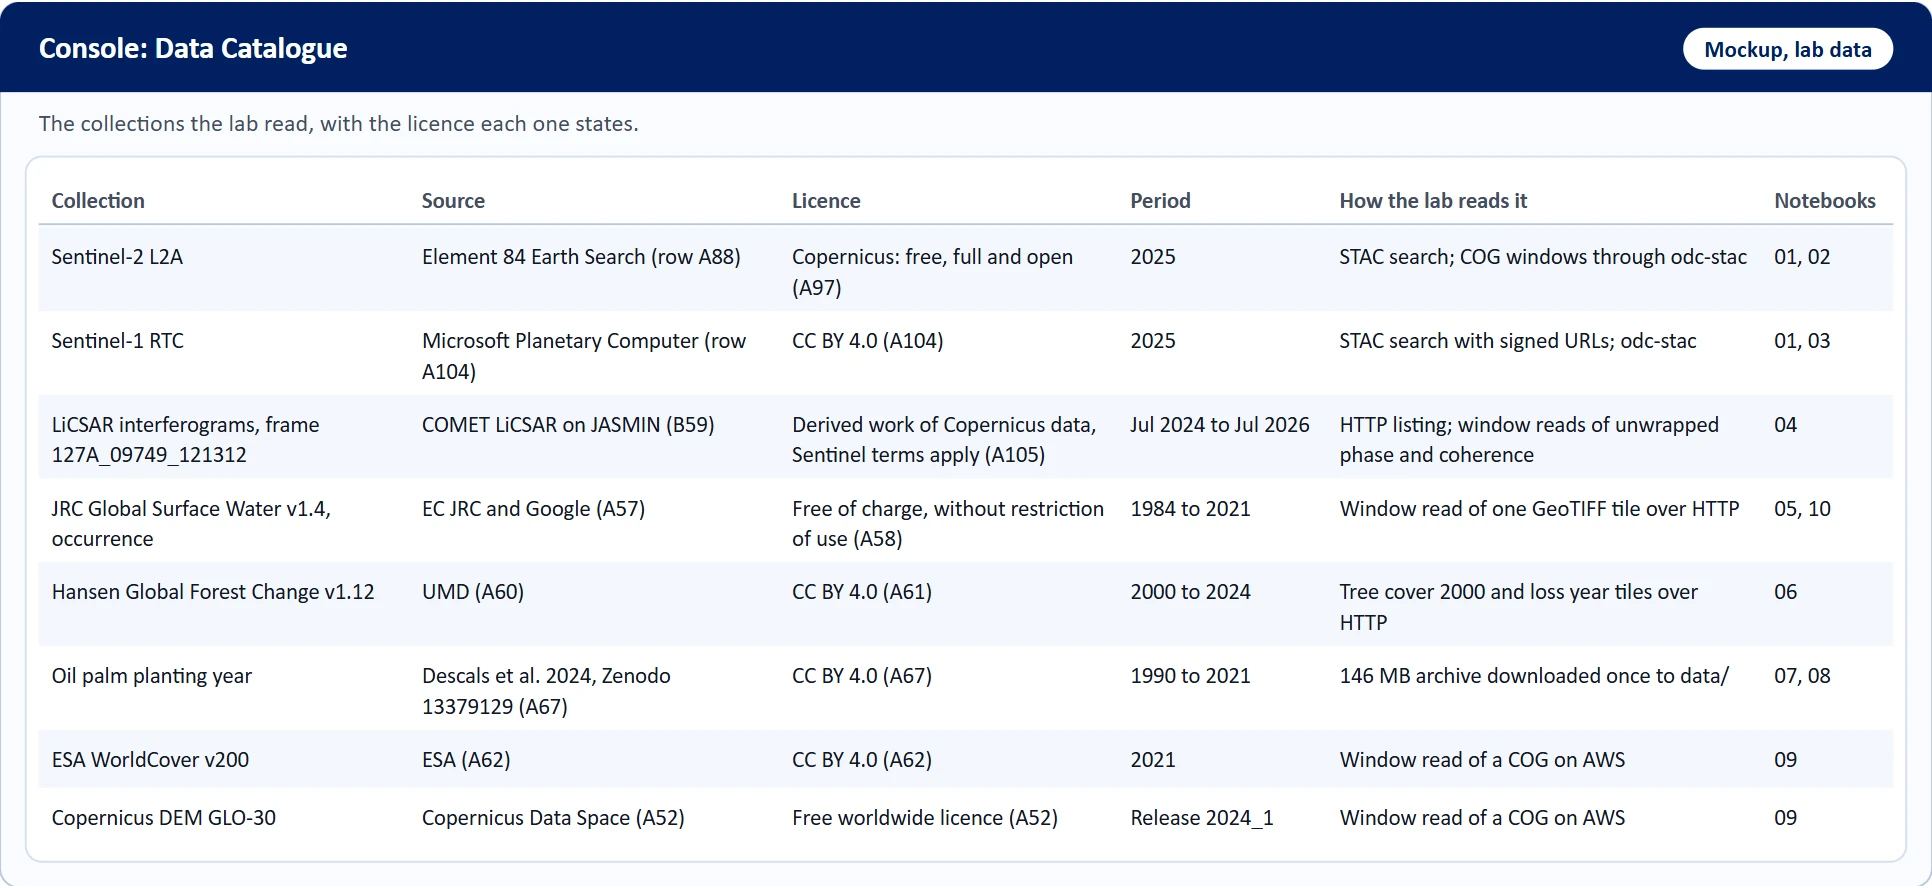
Most inputs are free, and almost all allow commercial use, with a credit line on every map.
Numbers That Can Be Compared
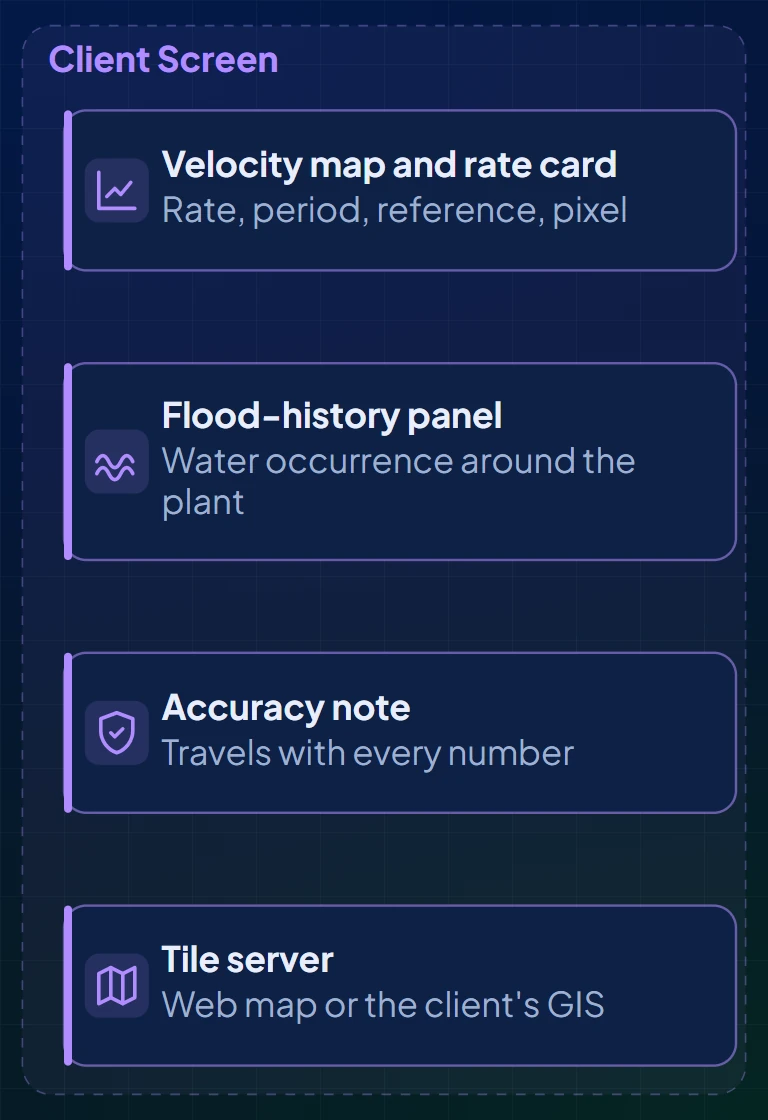
Ground motion comes with its rate, period, reference and pixel size, which decide whether it is comparable to anything else.
Every Factor on the Screen
The factors that turn hectares into megawatts are shown, because the total moves four to six times with them.
Validated Before Delivery
Every map is checked against a sample, with intervals, before it goes to the client.
A Record That Goes Back
Landsat reaches back to 1972, and forty years of water history are already classified.
How It Works
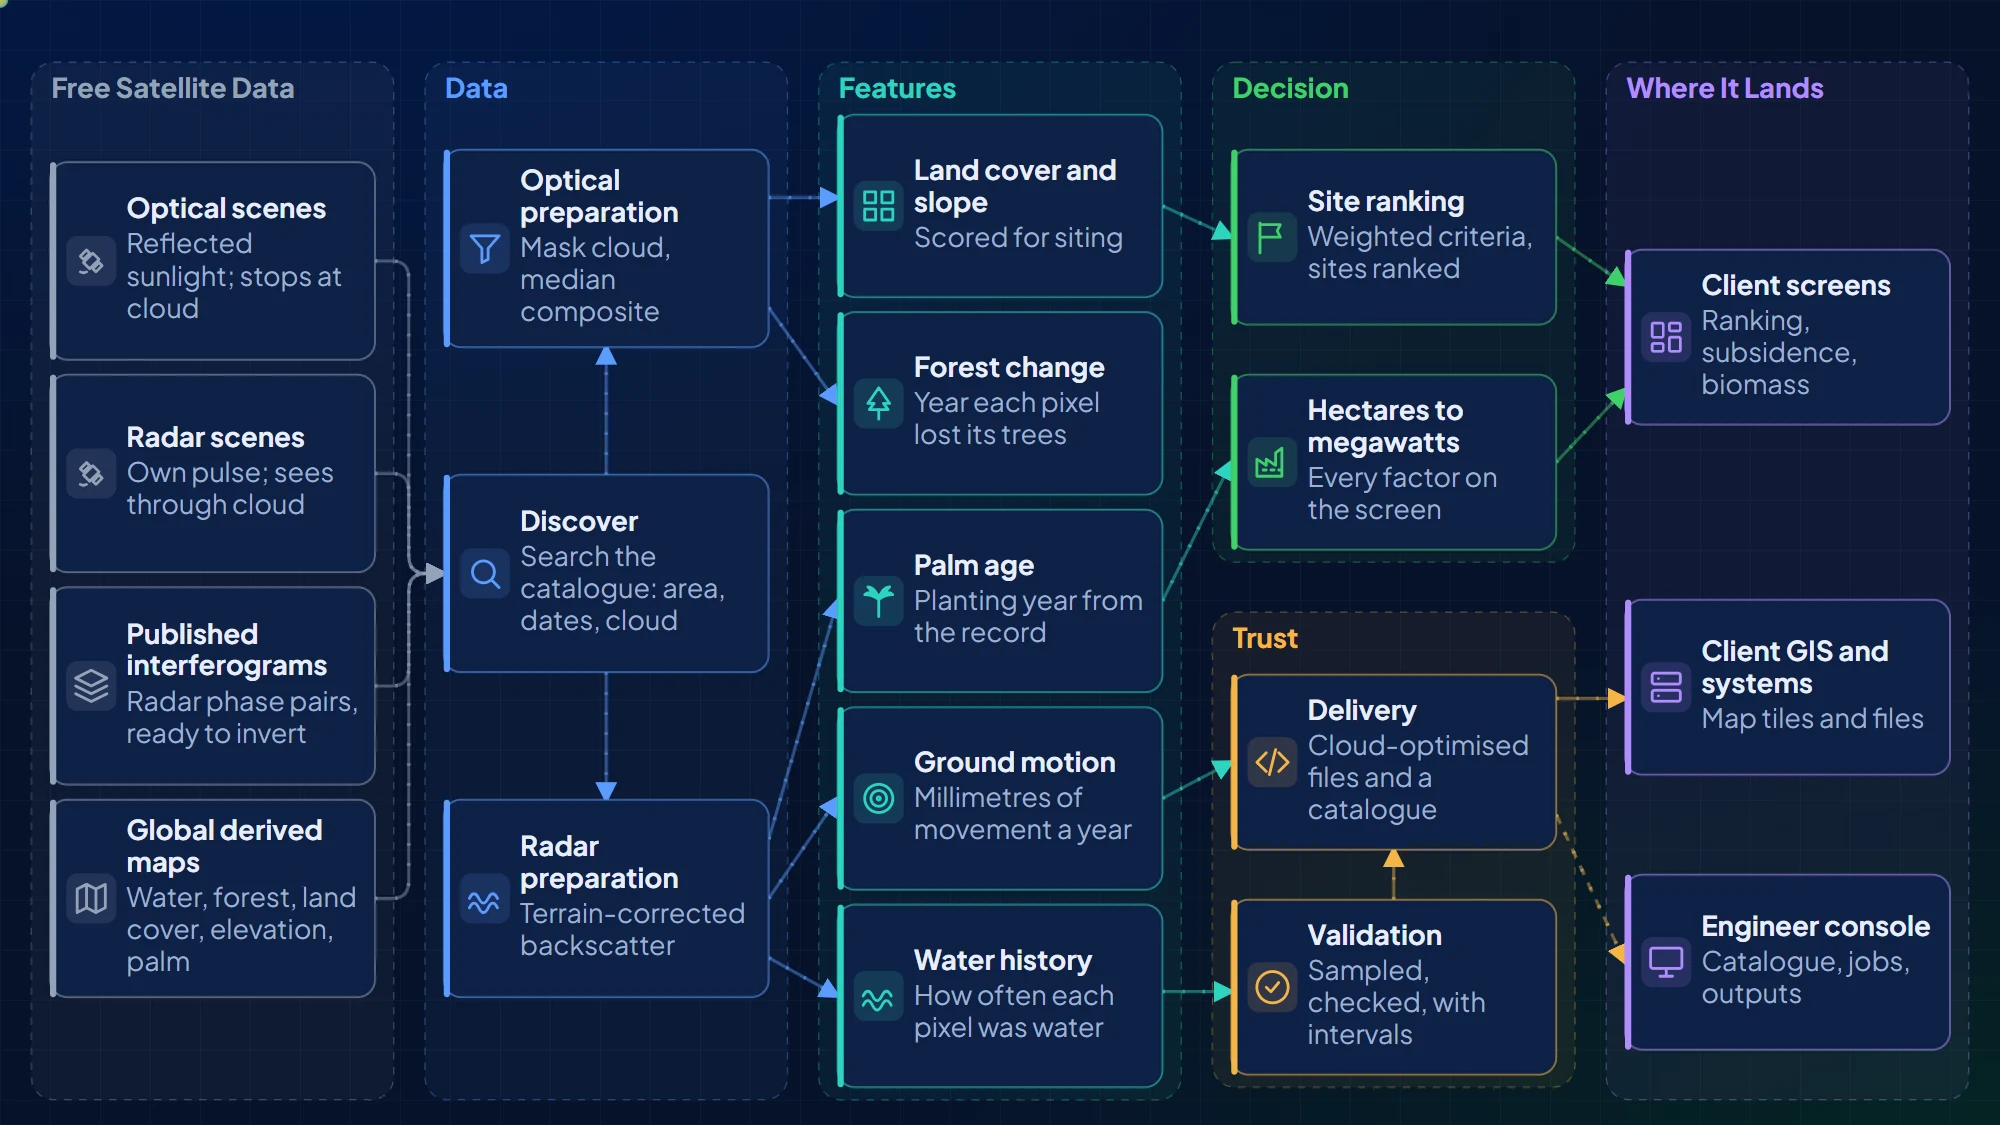
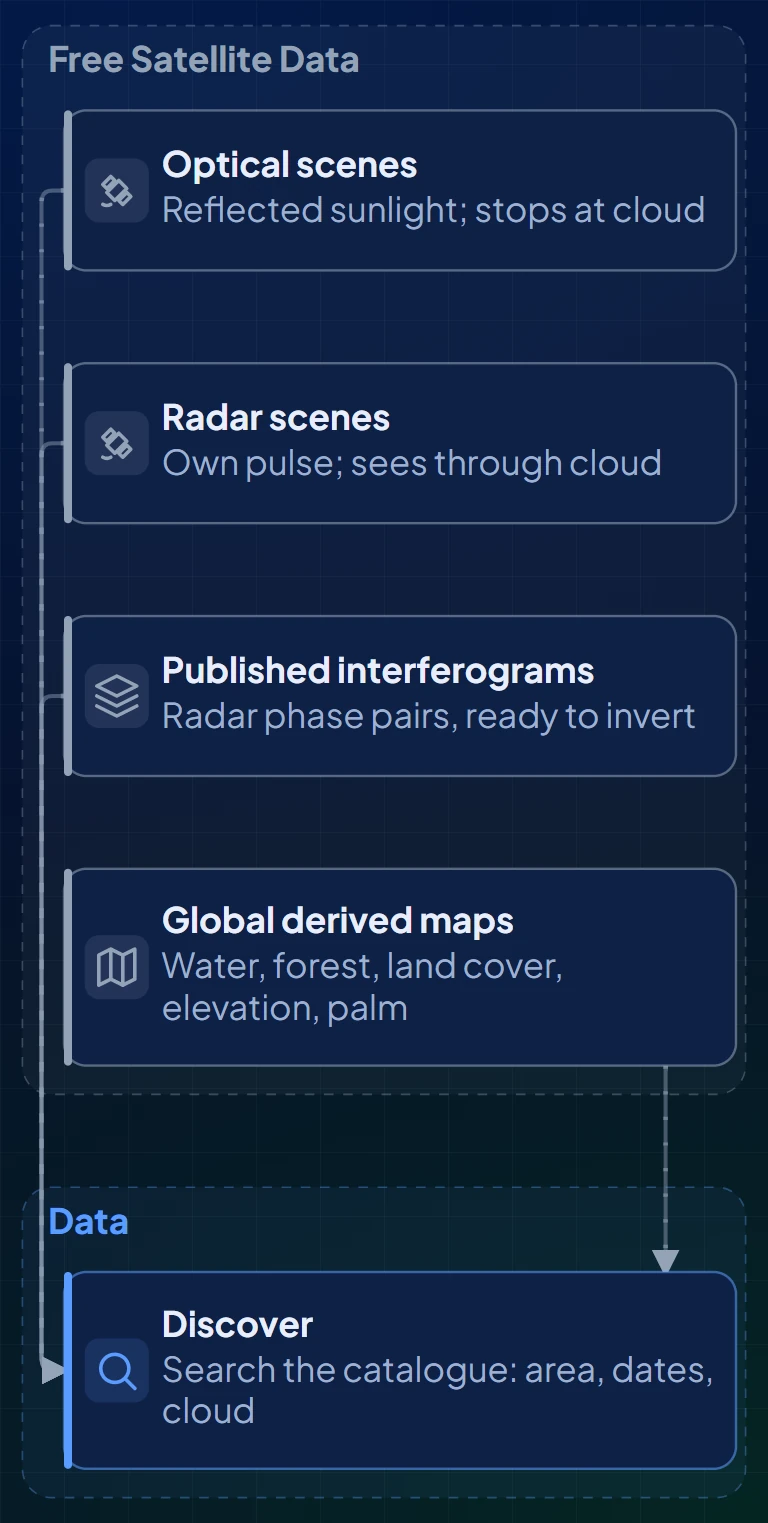
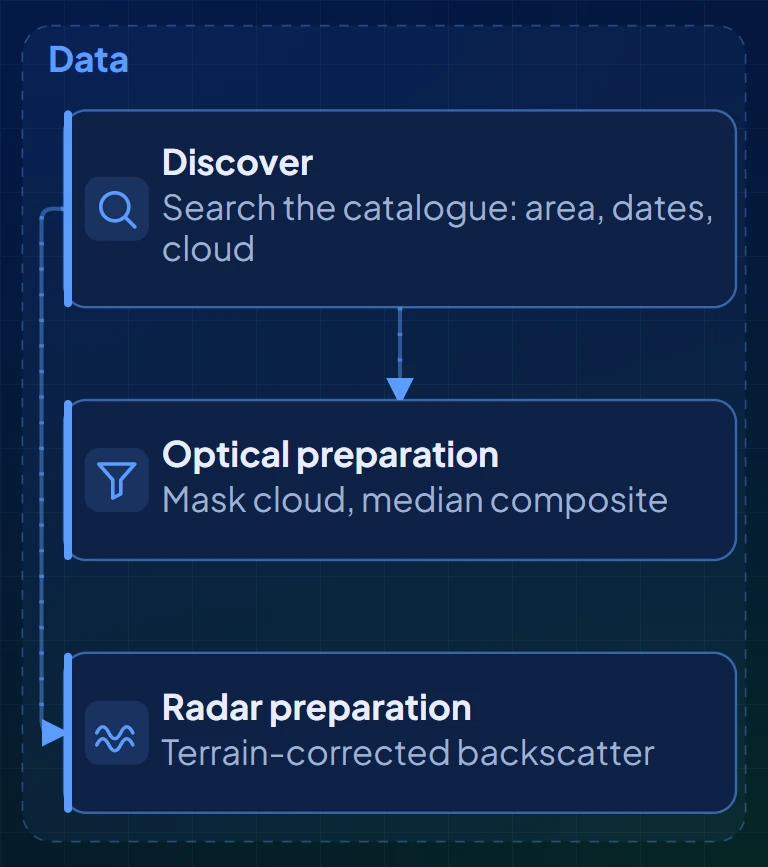
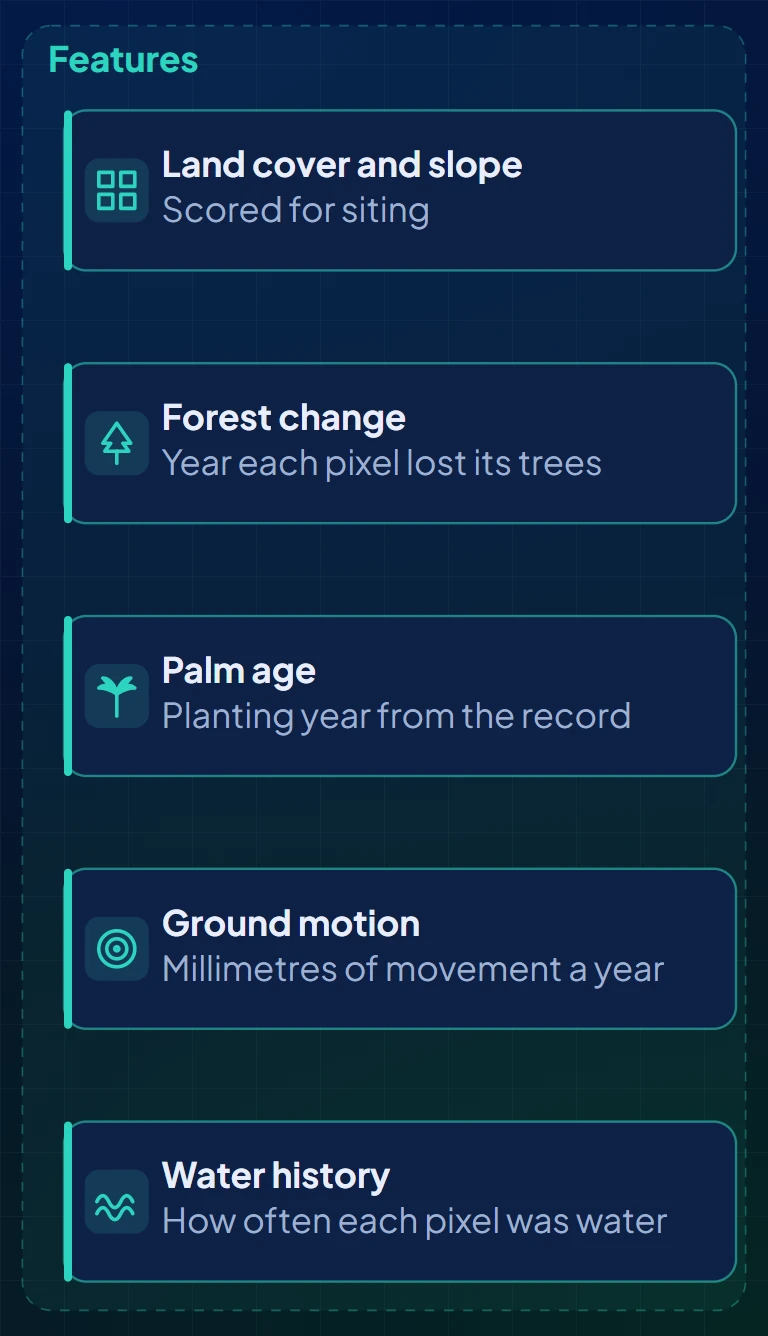
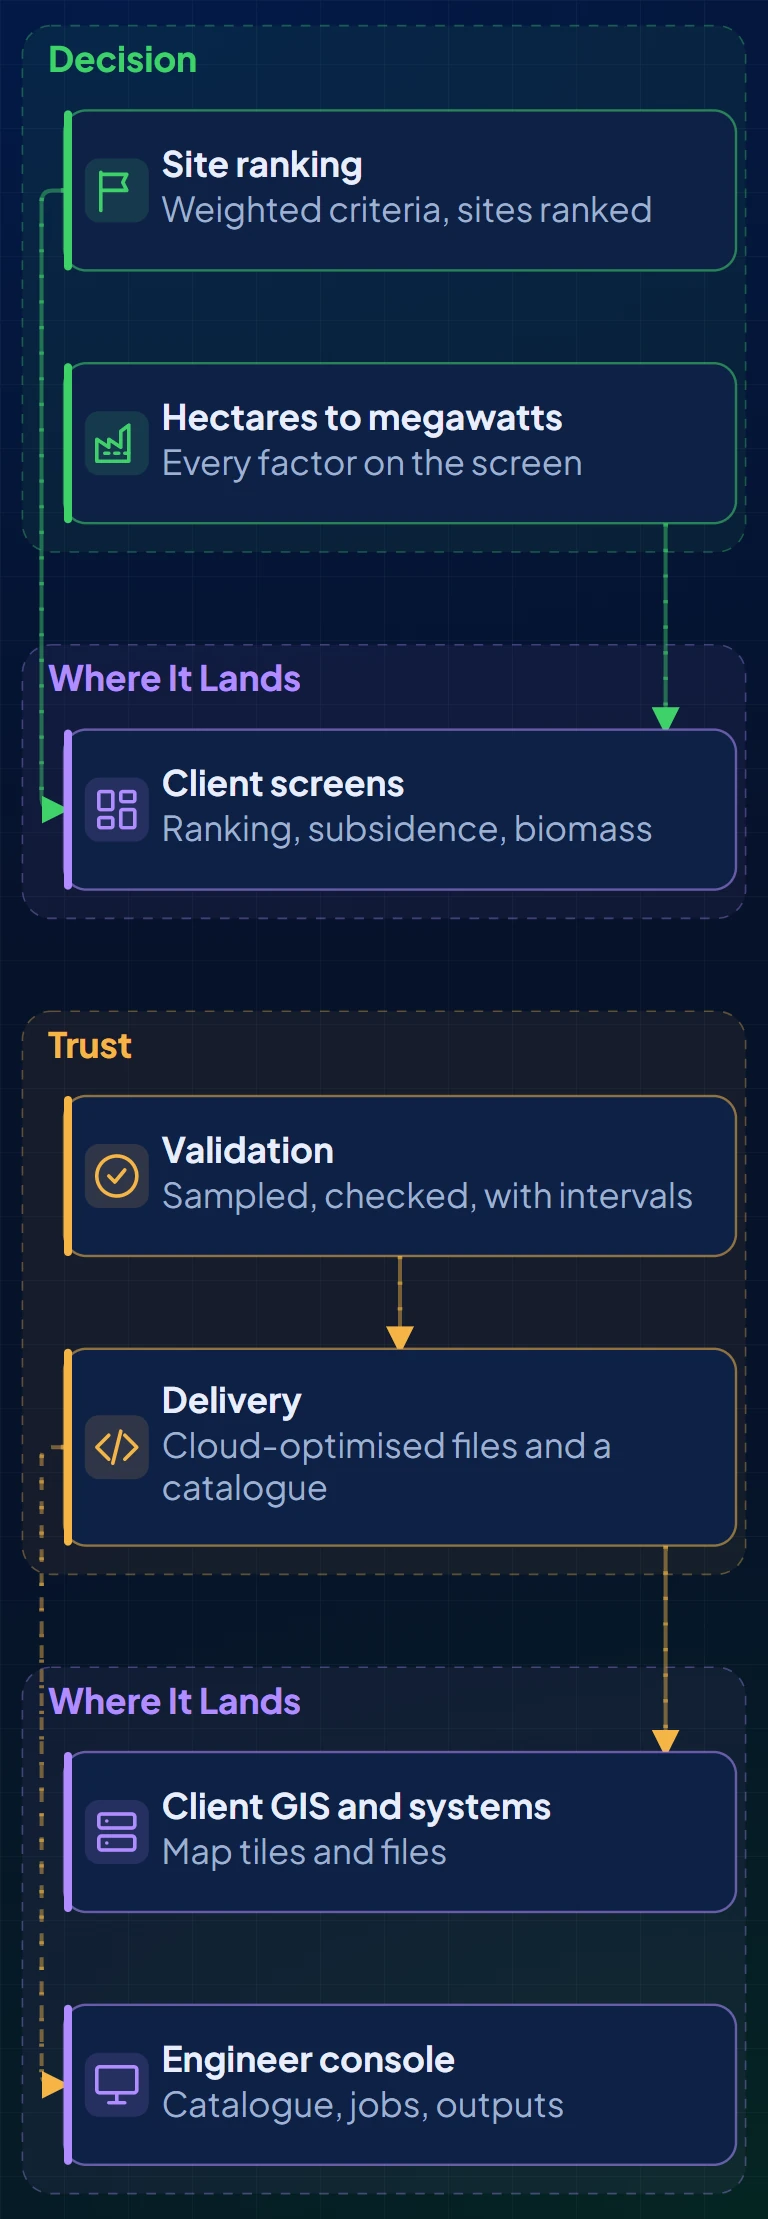
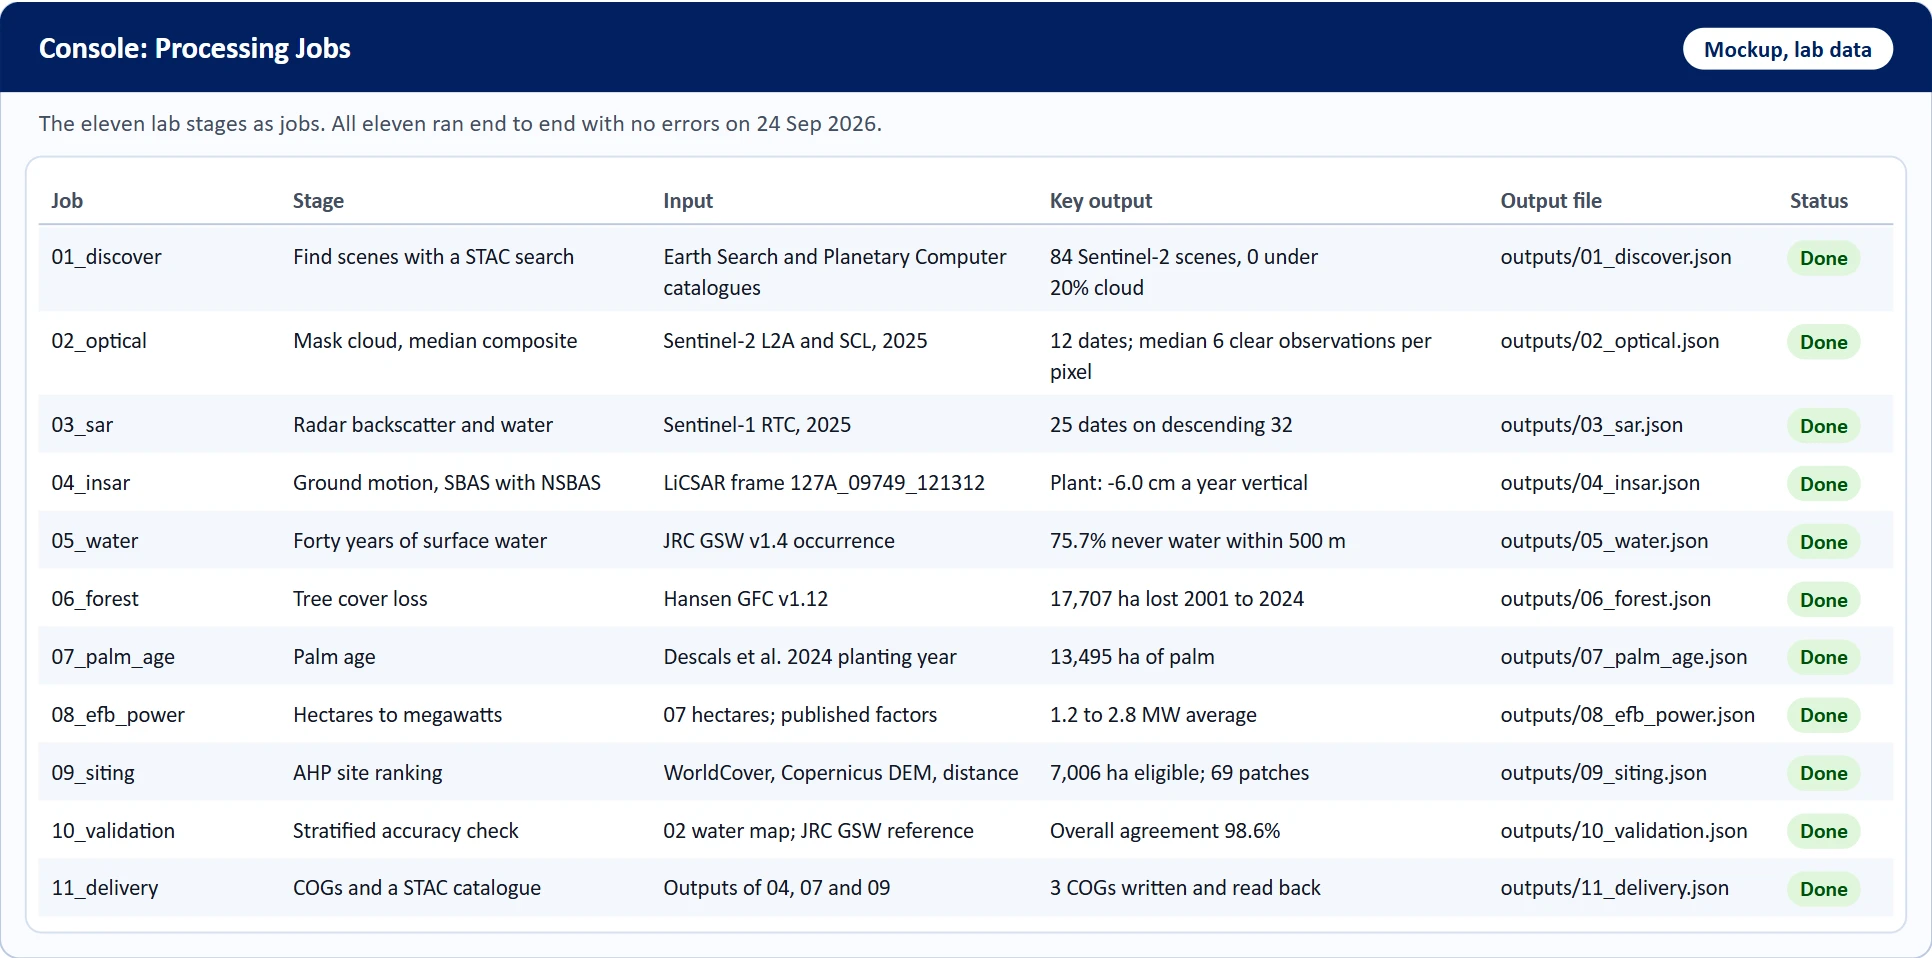
Eleven stages from a catalogue search to a file a client system can read, grouped as data, features, decision and trust. Each stage was run for real on public data.
Solution Architecture Overview
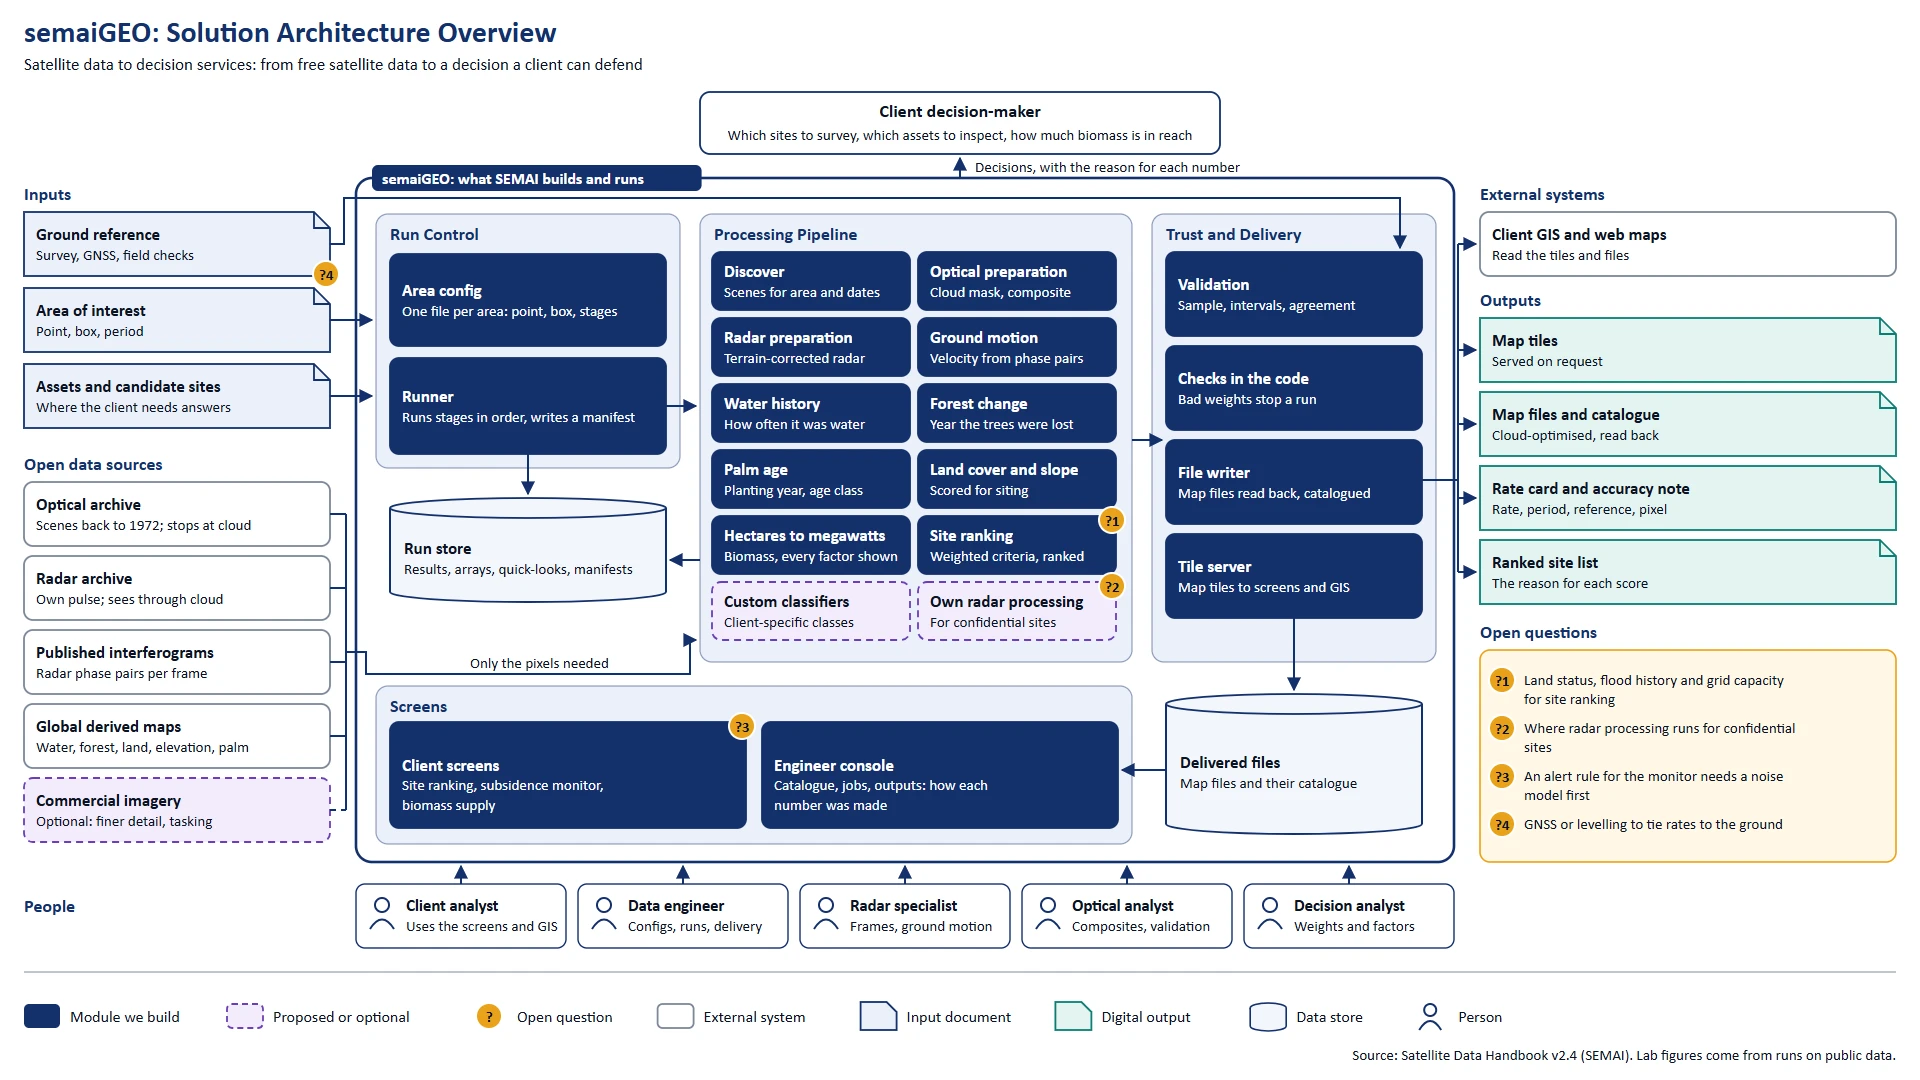
What SEMAI builds and runs: run control, the processing pipeline, trust and delivery, and the screens. Inputs and open data sources come in on the left; tiles, files, rate cards and ranked sites go out on the right. Questions still open are marked with a number.
For the complete view, open this on a laptop, PC or tablet.
Subsidence Monitor, from Config to Screen
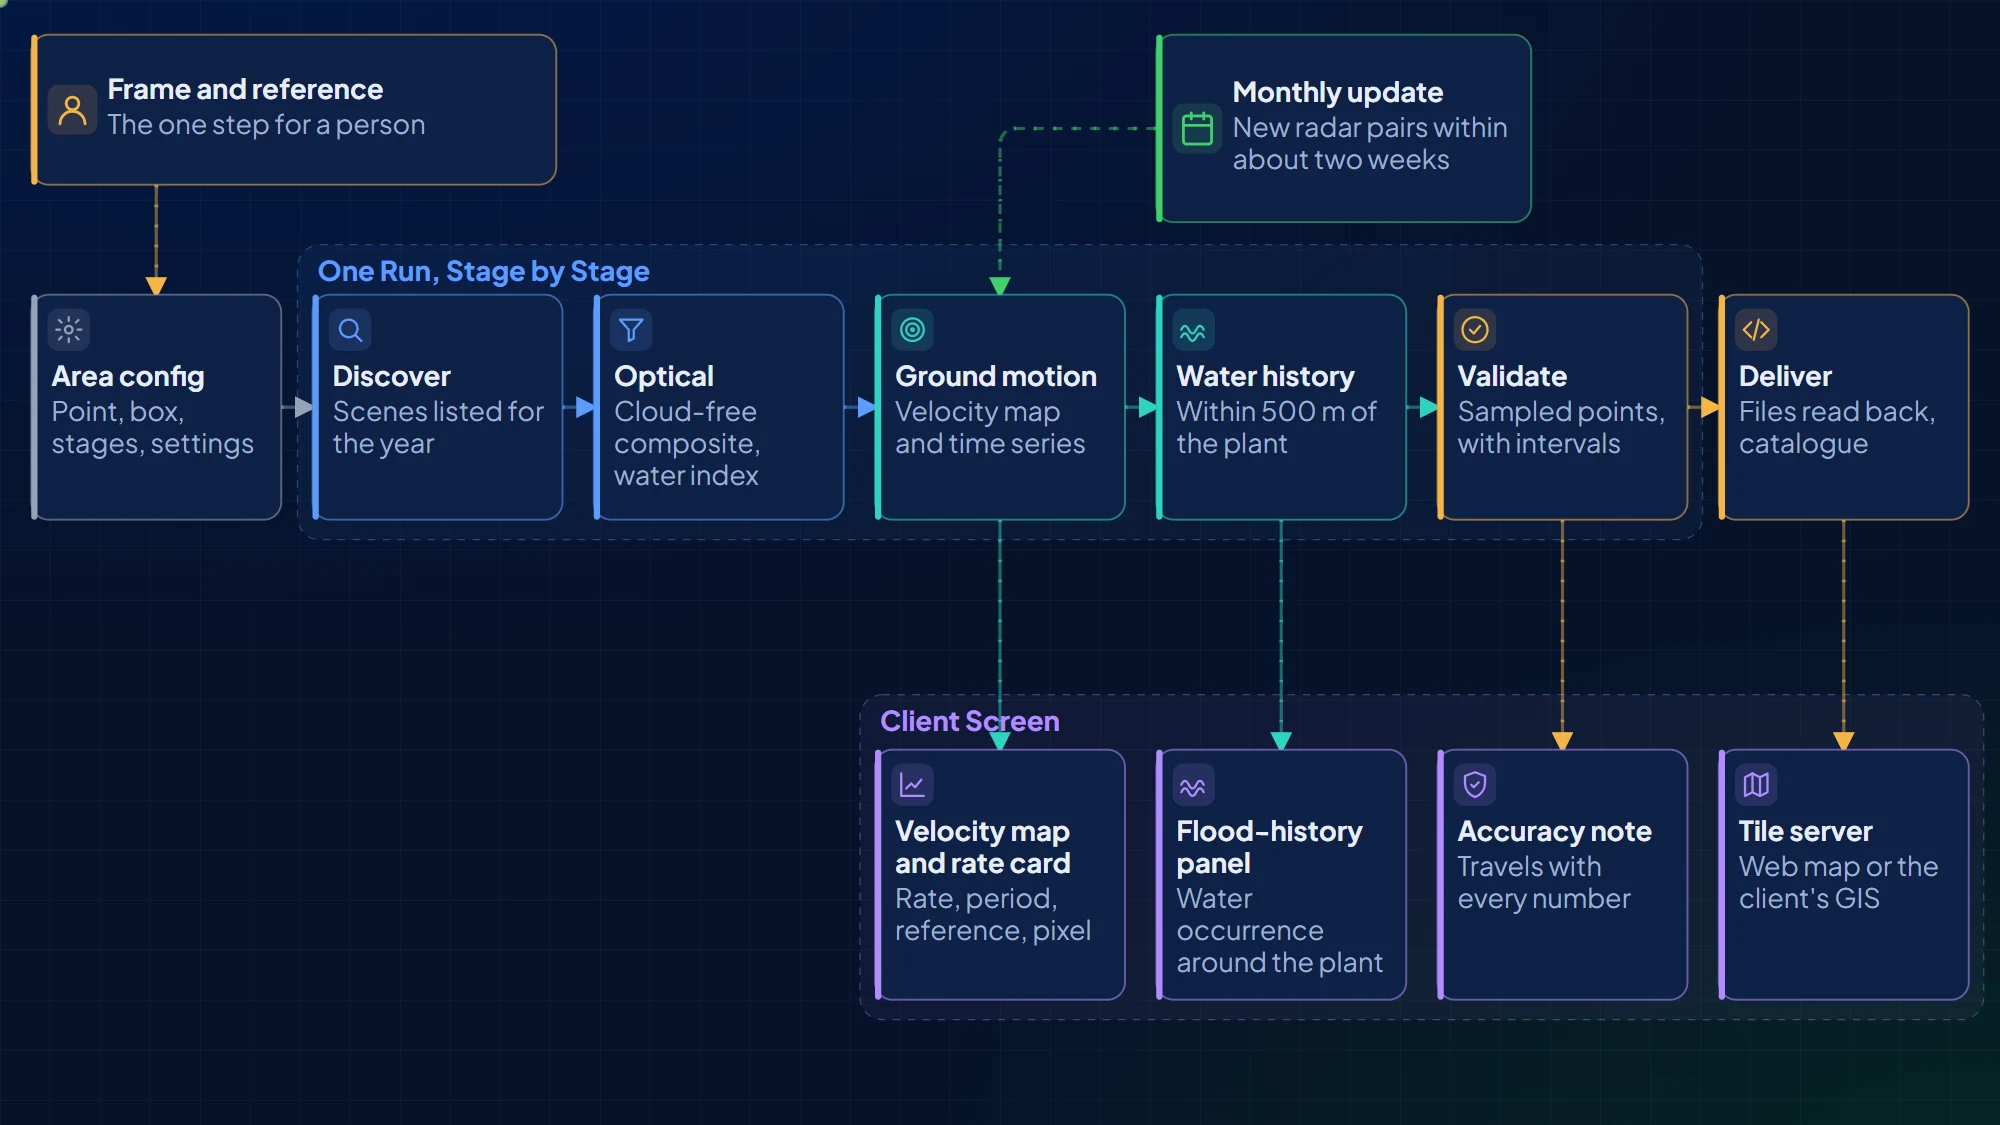
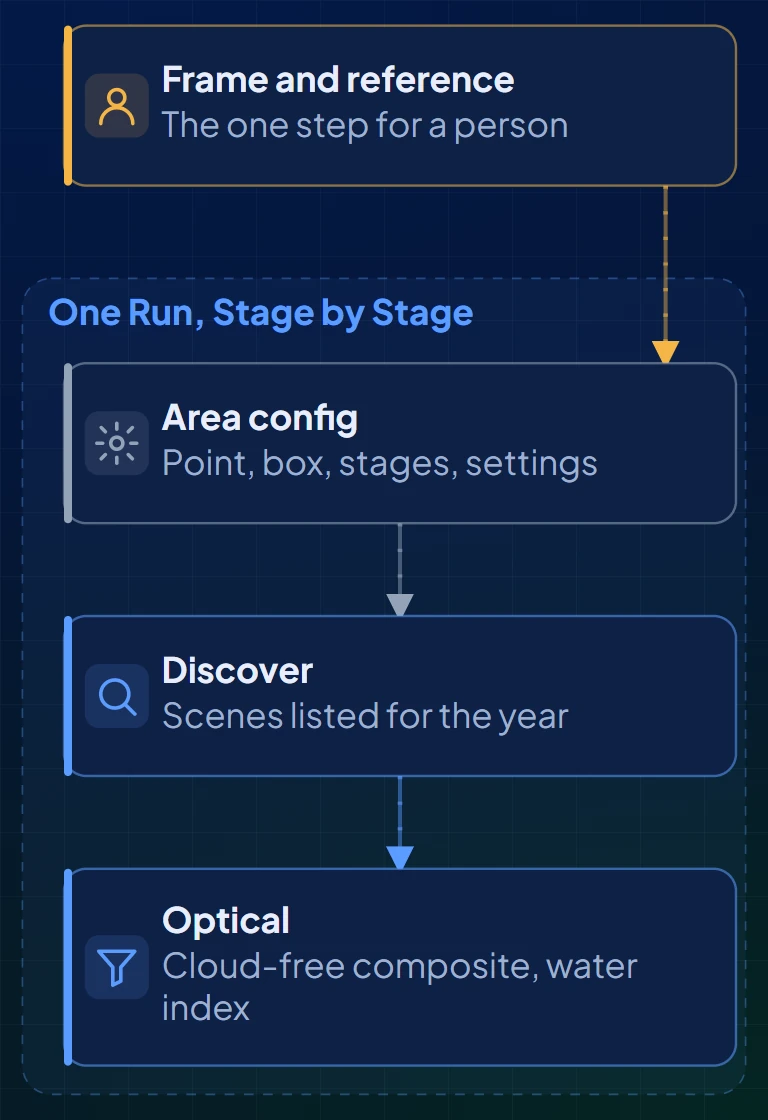
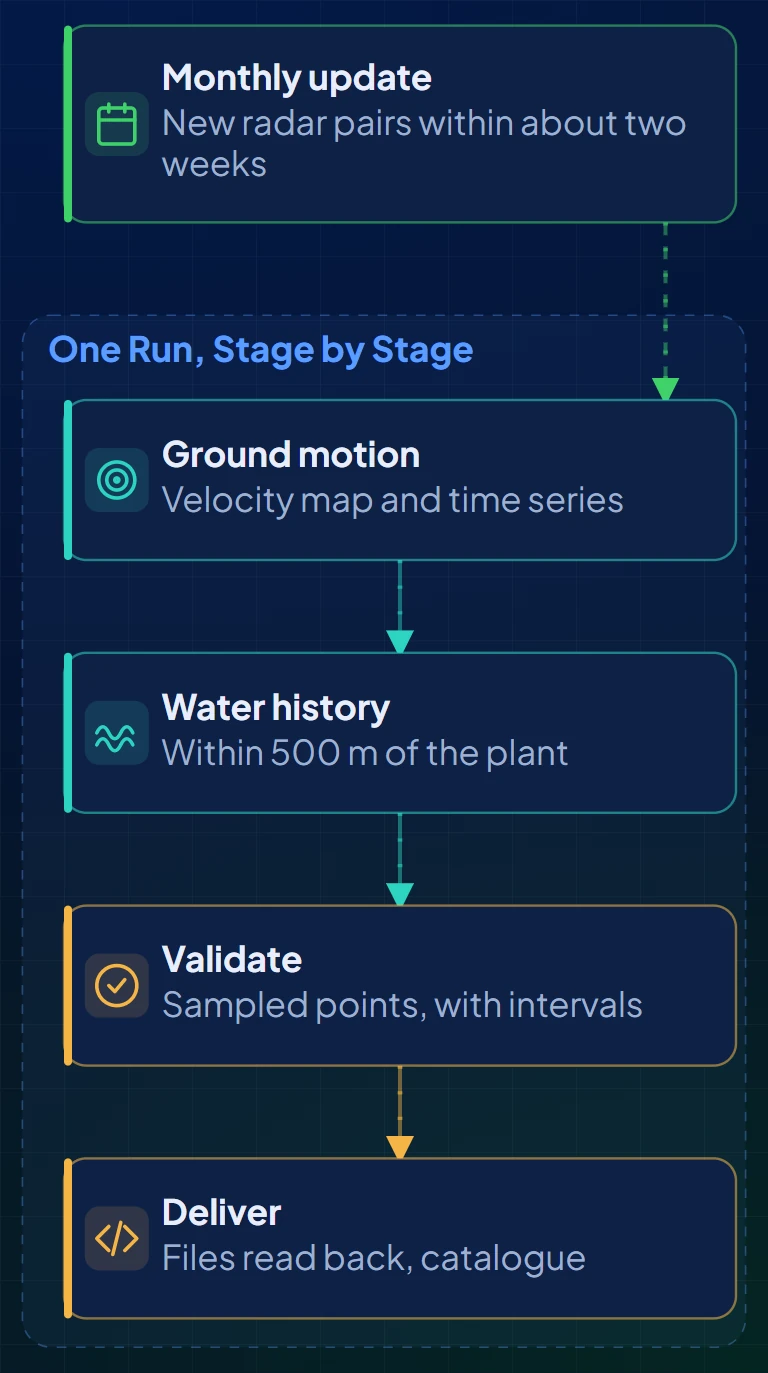
One config file per area, one command per run, a manifest per run. Looking up the radar frame and a stable reference area is the only step that needs a person's judgement. New radar pairs arrive within about two weeks, so a monthly update is realistic.
Example Screens
Mockups drawn from lab runs on public data: every number on them comes from a real run. Site and asset names are replaced with their type.
Let's Build #SmarterEnterprise
Start with: NDA & Joint Planning Workshop